How to Trade With The Exponential Moving Average Strategy

How to Trade With The Exponential Moving Average Strategy
The Exponential Moving Average, also referenced as an EMA Trading Strategy, is a widely utilized and
one of the most well-established methods of technical analysis for identifying market trends across
any and all markets.
By using a mathematical formula, the Exponential Moving Average calculates
the constant average price reflected over a specified period of time or “lookback period.” Shorter
look back periods will result in more volatile reactions due to the involvement of price changes. The
EMA Strategy does not predict the market but instead aids in the analysis of current market
conditions, thus making it a more reliable source of either support or resistance for trading
strategies by placing emphasis on the most recent prices.
Calculating the EMA
The Simple Moving Average (SMA) is used as the starting point of the range of prices used to calculate the EMA value. We can calculate the SMA by summing the number of time periods included and divide by a multiplier that focuses the moving average indicator’s curve.
Any time period can be utilized: 10 days, 30 minutes, 40 weeks, etc. Some commonly used time periods
for EMA analysis are 10, 20, 50, and 100 days, but most traders use time periods between 10 and 100
days with bands of 1-10% distance between moving averages. Most trading platforms come equipped with
charting software that does these calculations for the trader, but a breakdown of the formula is
provided formula below.
Once the SMA price and time period multiplier have been determined, we
must calculate the EMA. We do this by subtracting the closing price from the previous period’s EMA and
multiply it by our time period multiplier. Then, we add the EMA of the previous day.
20-day EMAs follow prices closely and produce minimal lag in price reversals when compared with 50 or 100-day longer-term EMAs.
Initial SMA = 20-day period sum / 20
Multiplier = (2 / (Time periods + 1) ) = (2 / (20 + 1) ) = 0.0952(9.52%)
EMA = {Close - EMA(previous day)} x multiplier + EMA(previous day).
EMAs will react faster to price changes than the SMA due to the weight placed on the recent pricing data available.
How to identify when to use an Uptrend EMA Strategy vs a Downtrend EMA Strategy
- Uptrends in the market occur when the price trades above the moving average.
- Downtrends are when the price trades below the moving average. Trading below the moving average
results in lower prices.
Trades based on EMA should be executed once a strong trend has been indicated. Trades placed should then not deviate from that direction. The use of an EMA Crossover Strategy can help identify market upward or downward trends and provide support or resistance to trading within them.
EMA Crossover Strategy

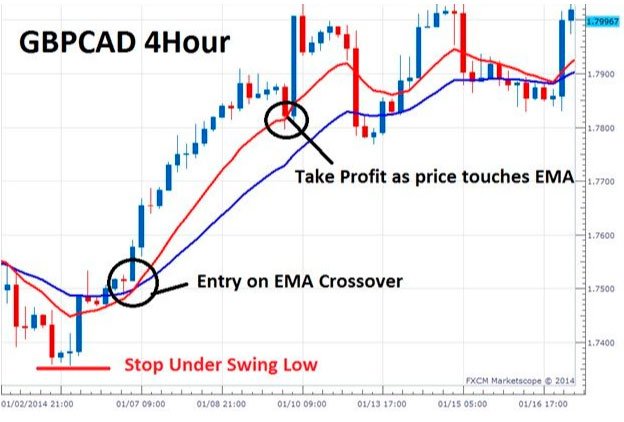
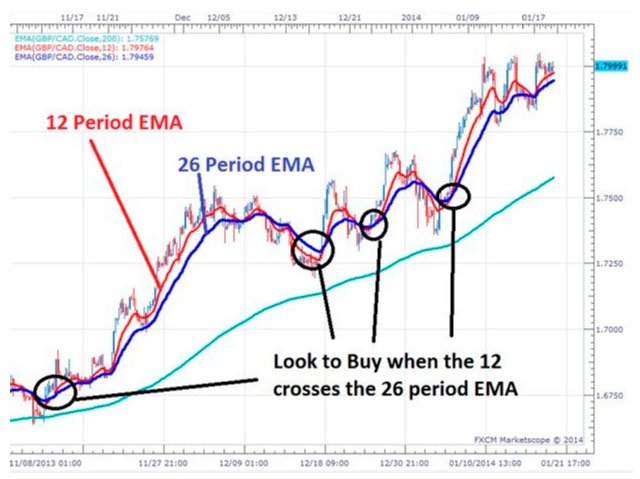
Forex traders tend to utilize a short-term moving average crossover long-term moving average over various timed intervals, currency pairings and band percentages. The goal of the EMA Crossover Strategy is to capture a new trend by utilizing two EMAs, one with a long period and one with a short period. One commonly used EMA Crossover Strategy is the EMA 12 and EMA 26. It is widely popular amongst Forex trading. An example has been provided below for a buy trade in a bullish market.
EMA 12 and EMA 26 Trading Strategies
This strategy is a combination of two specific EMAs, one with a period of 12 days and another with 26 days. This is also known as the Moving Average Convergence and Divergence Strategy. Note that this is a more volatile strategy due to the shorter time period, so be aware of risk when utilizing.
An example of a BUY trade is below:
-
Plot out 12 day and 26 day EMAs
a. Most standard trading platforms come with default moving average settings that may need to be changed (envelope percentage, time period, etc) based on market volatility.
- Wait until price trades above 12 and 26 day EMA and EMA Crossover
a. Markets are easily susceptible to false breakouts. A simple EMA Crossover above to 26-day EMA may not be bullish enough to warrant a higher price push if bought for profit. - Wait for two successful EMA Crossovers between 12 and 26 day EMAs
a. This allows the market to develop and prove the trend - When to Buy: Third EMA Crossover
a. At the third successful EMA Crossover, buy at market price. Bullish momentum now strongly implicates a bullish market. - Protect your Investment against False Breakouts
a. Place a Stop Loss one pip pips below 26 EMA nearest the swing point level - Exit the Position with a Profit
a. Base on a 1:2 setup or once stop losses have been triggered
b. Once the trade has been placed and closes below 26-day EMA, the moving average is now out of date.
c. Note the market slope on both the 12 and 26 day periods. In an uptrend, take a long position when the 12 period EMA is above the 26 period EMA during an intraday basis.

EMA 20 and EMA 50 Trading Strategies
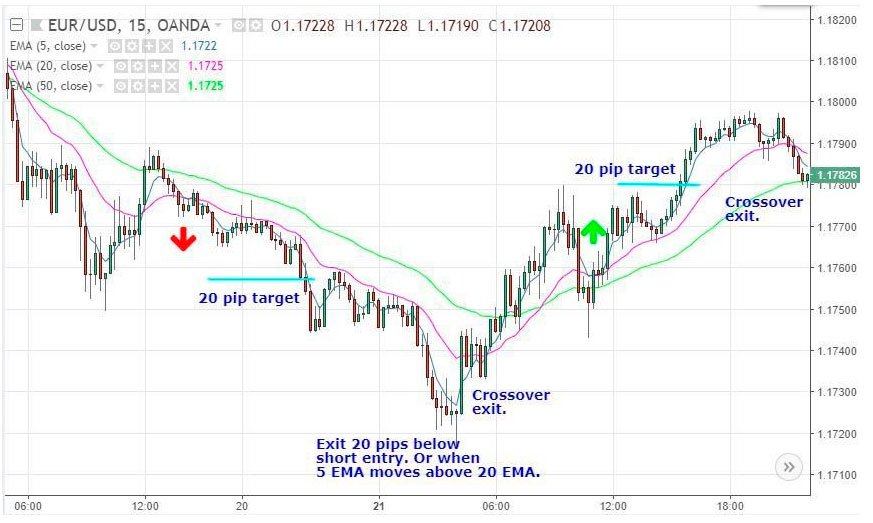
Another popular EMA Strategy used by Forex traders is the crossover of short and long term time periods such as the 20 and 50 day EMAs for trading signals. This strategy will yield more pips if given a large time frame. An example for a Sell trade used by EMA Forex traders is provided below.
-
Plot out 20 and 50 day EMAs
- Wait until price trades below the 50 day EMA
- Wait until the price breaks the 50 day EMA downtrend and closes below entry
- When to Sell: Place a sell stop order 2-5 pips below candlestick low in anticipation of false
breakouts
- Protect your Investment by placing a stop loss 5-10 pips above the high
- Exit the Position with a Profit when the false break proves true or trailing stop loss is
triggered a few pips behind high swings during price volatility.

Remember that while this EMA Crossover trading strategy is simple and easy to use, it does contain risk. Keep in mind the sizes of your trade and aim to start with 1-2% risk per trade. Also note the market you are using this forex strategy in and be aware that non-tending markets might not be ideal due to volatility, lagging and false breaks.


