Forex Weekly Forecast & FX Analysis April 26 - 30

EUR/USD
The euro continues to strengthen its position against the US dollar. Last week, the price of the asset rallied, reaching an important psychological level, and tested it twice. Therefore, it is very important to note that the value of the currency pair is growing, while the indicators are looking down. It is important that this applies to absolutely all indicators. Thus, we can talk about divergence, which means we have every reason to open a downward contract. We take into account that we are trading against the trend of the last month, and also take into account that the level of moving averages is below.

GBP/USD
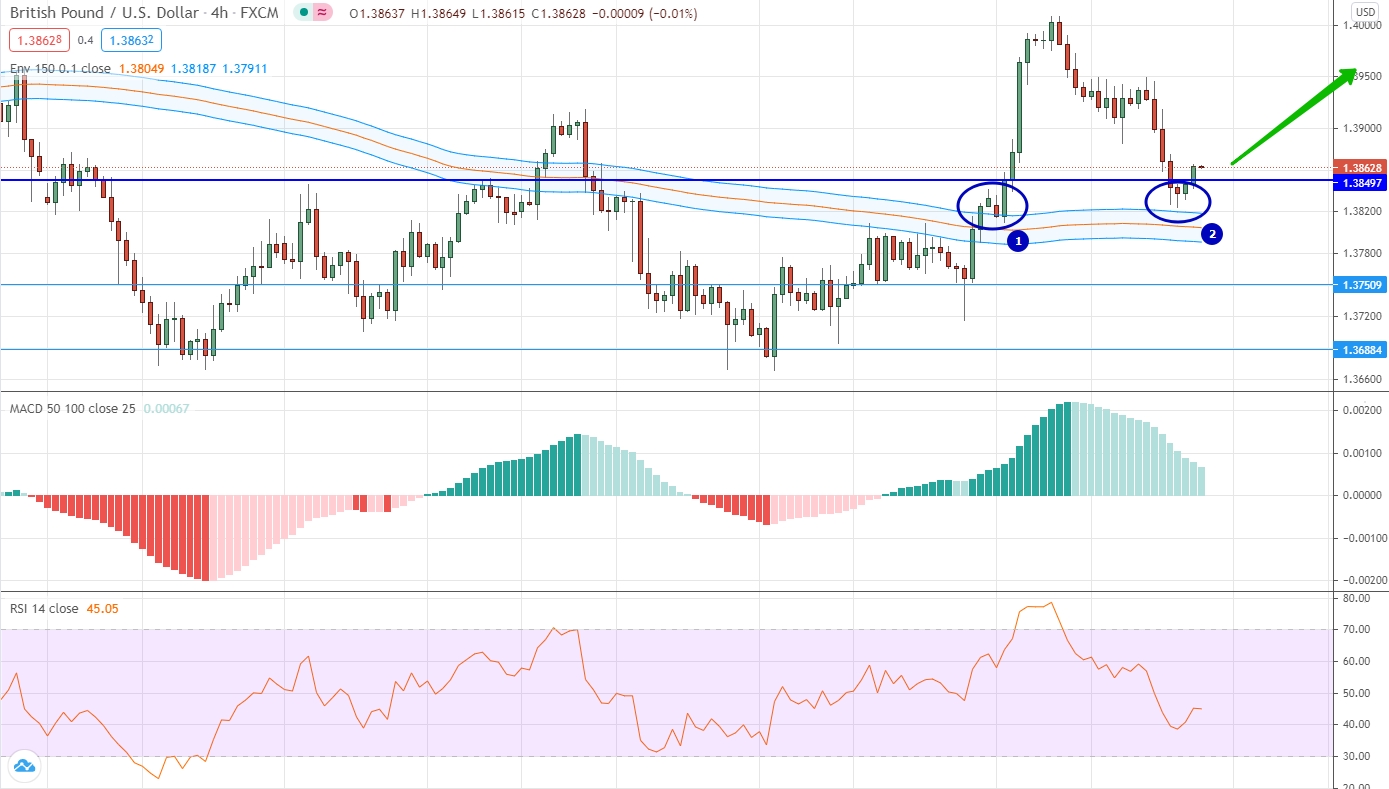
The British pound against the US dollar is showing attempts to form an uptrend after a long sideways trend. Of the most important trends of the past week, it is important to note that the price rose above the level of 1.3850. At the same time, the price tested the level of moving averages twice, and the second test took place quite recently. Taking into account the fact that after the test of the moving averages the market has already risen above an important level, we can consider options for trading up.
USD/JPY
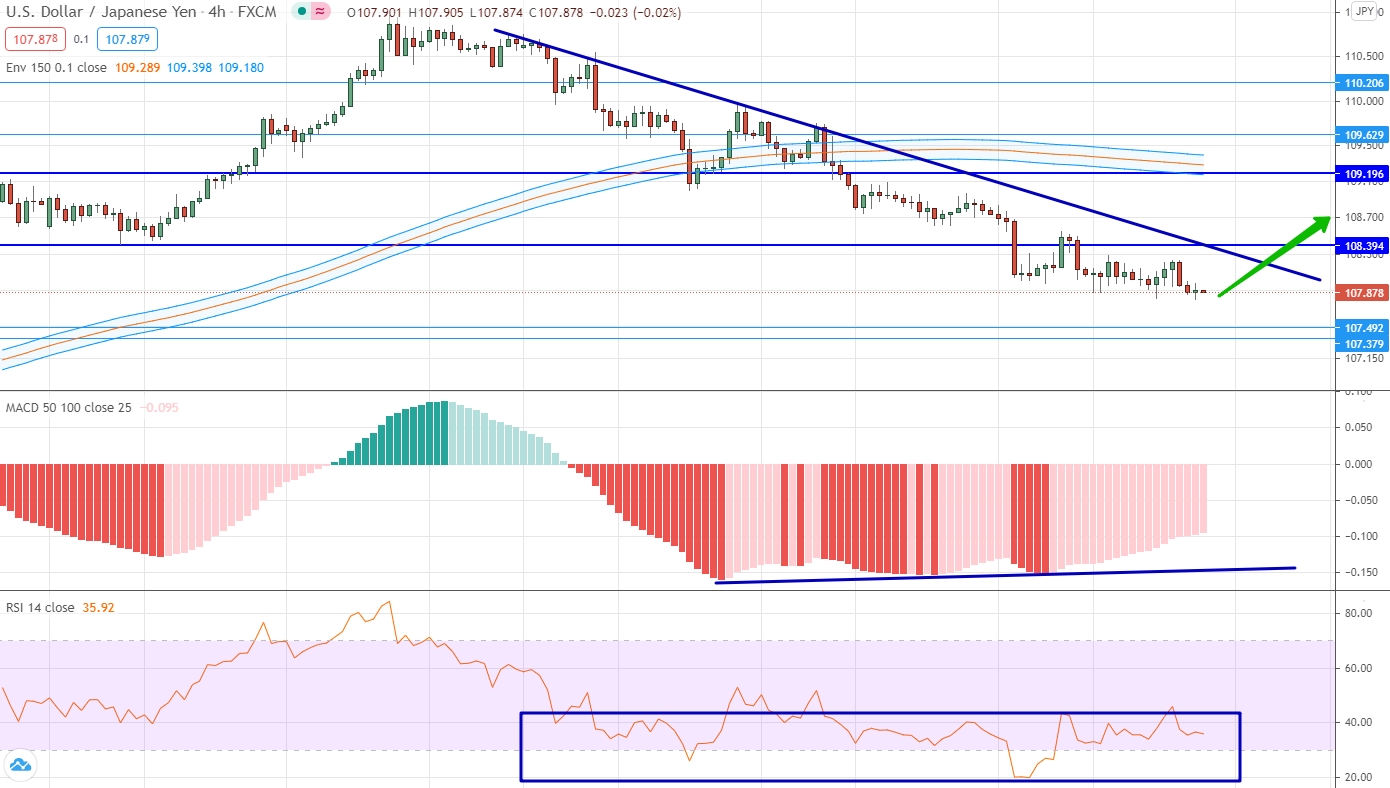
The dollar continues to develop a downward trend against the Japanese yen. It is characteristic that the downward movement has already consolidated below the moving average and below several important psychological levels at once. The downward trend is perfectly confirmed by the oscillator, which is mainly built close to the oversold level. If you study the histogram, then it is very important to note that it is plotted in the negative area, but has, albeit a minimal, upward slope. Thus, we can talk about an atypical divergence, and therefore about the possibility of opening a contract for an increase. This assumption is reinforced by the fact that the market was going down for a very long time and it may need a correction with a target at the level of moving averages.
AUD/USD
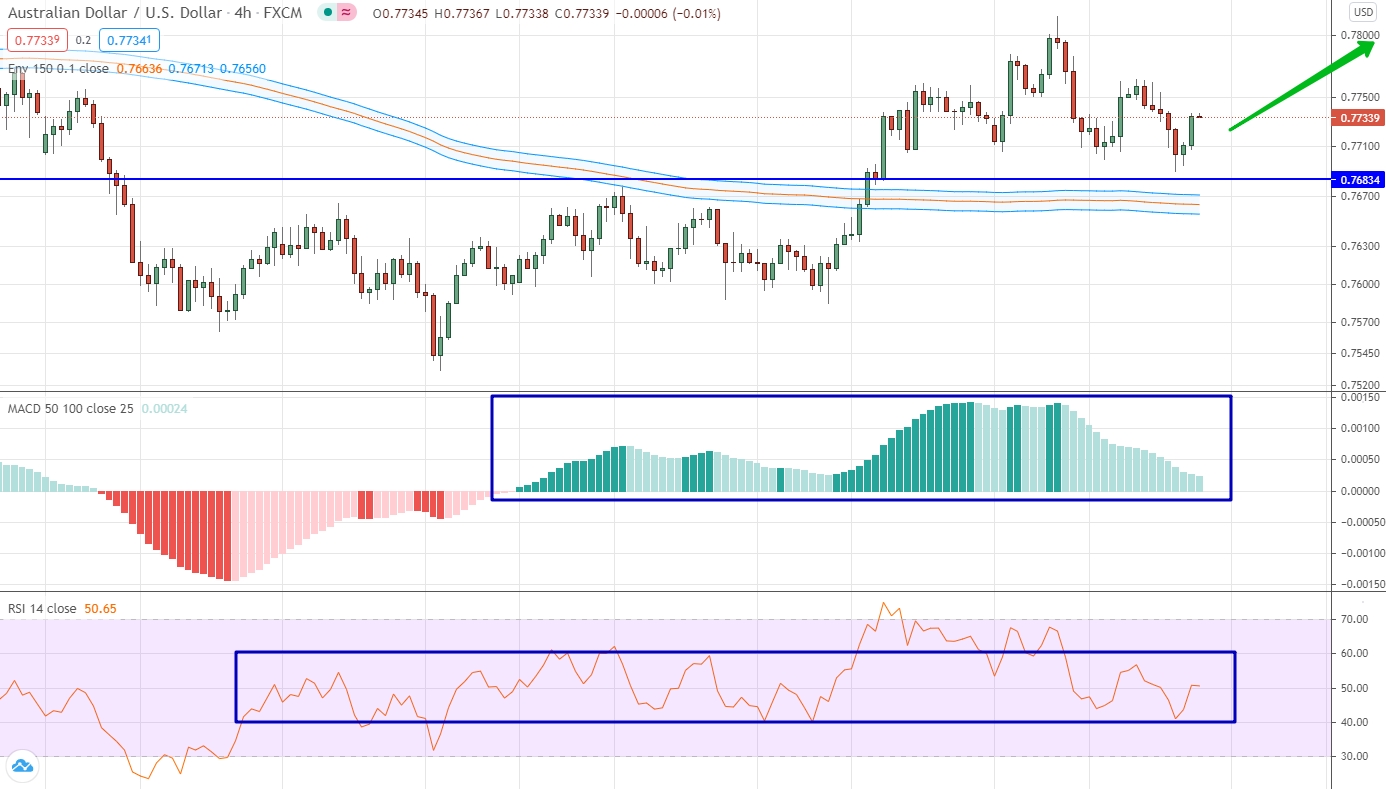
The currency pair Australian dollar against the US dollar is characterized by the dominance of a slight upward trend, as well as the absence of volatility. The latter is very well traced by the oscillator, which is mainly built in the area of level 50. The indicator cannot move away from this level significantly, but as soon as this happens, it quickly returns to neutral levels. The histogram is plotted in the positive area, which only confirms the upward trend, but does not give specific signals for trading. Given the dominance of an uptrend and the absence of specific signals from indicators, we can only consider options for trading up.
USD/CAD
Trading in this currency pair is characterized by insignificant elements of the trend movement, but very high volatility. The volatility can be traced especially well in the trades of the past week, where the price of the dollar against the Canadian dollar overcame the distance of more than 200 points in just a few hours. The absence of a trend can be clearly seen from the indicators, which are mainly built near neutral values and do not even attempt to move away from them. However, we note that the price is below the moving averages and below the 1.2540 level. Therefore, we can consider options for trading a fall.

USD/CHF
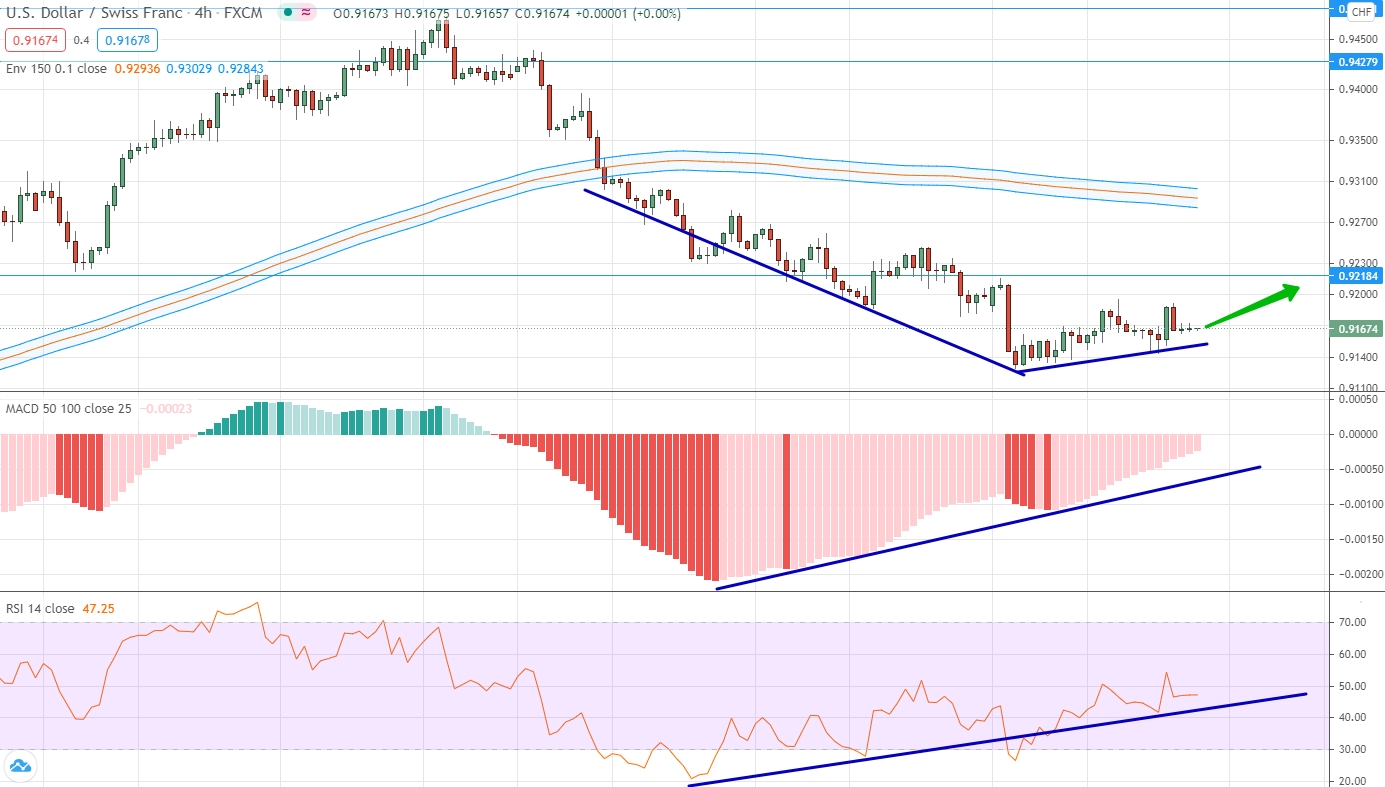
The US dollar has been trading mostly negatively against the Swiss franc in recent weeks, which led, in particular, to the fact that the market was below the moving averages, and the averages themselves changed the slope to a downward one. If you look at the indicators, they have tested their minimum values for a very long time and are building in the direction of growth. Moreover, all indicators are already close to neutral values and going into positive territory. Thus, we are talking about an atypical divergence, as well as the possibility of trading up. However, we take into account that the important level 0.9218 and moving averages are on top.
USD/RUB
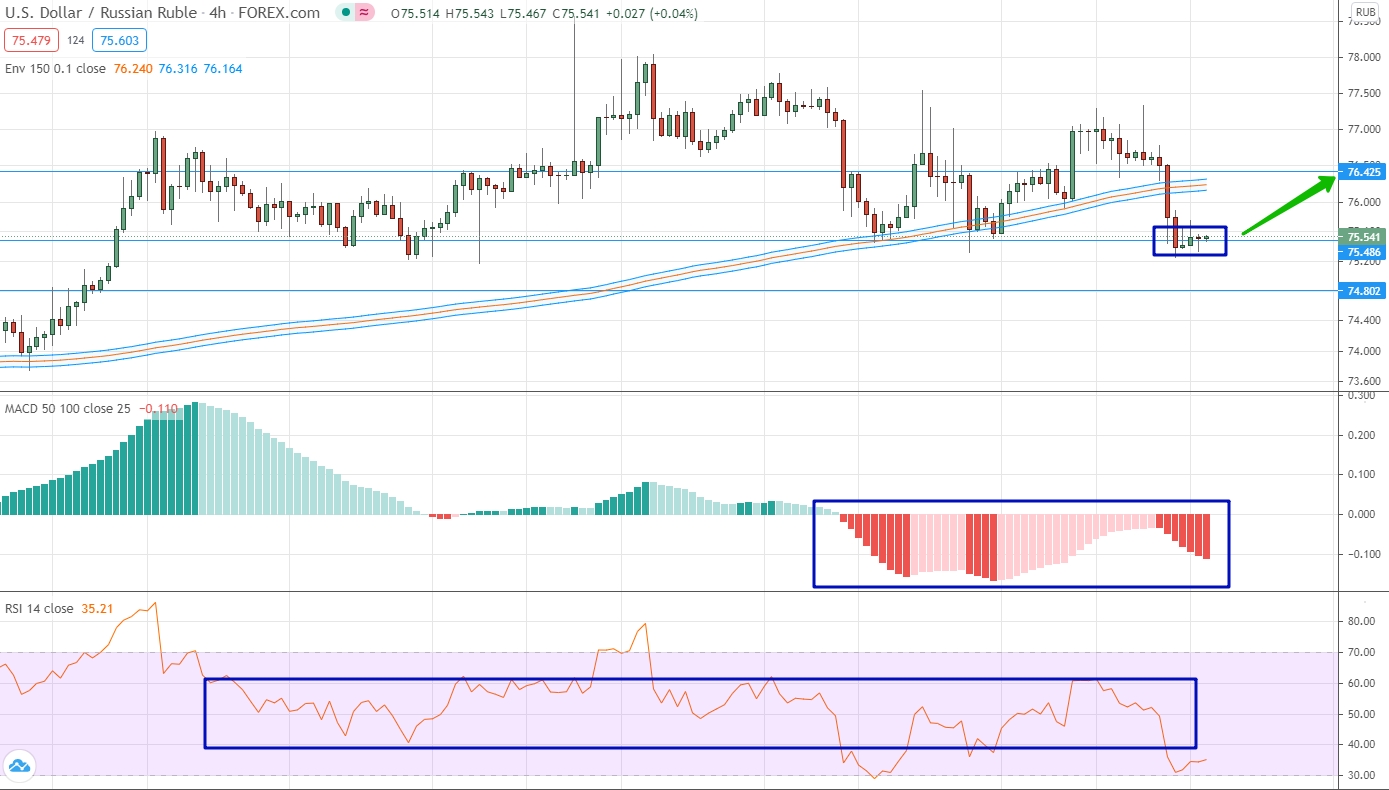
Globally, an upward trend dominates for this currency pair, but if we consider the trades of the last weeks, then here we can mainly see a sideways movement. Trades in recent weeks have again led to the significance of the sideways range with the borders of 75.48 and 76.42. Pay attention to the oscillator, which has been building near the 50 level for more than a month and cannot last much longer. From the current position of the price, it is very important to note that the market is close to the lower border of the channel, which was mentioned above. Therefore, in the aggregate, we can consider options for trading up.
Gold
Gold has generally been trading positively in recent weeks with a clear upward trend. This is primarily seen in the chart, where the price has already risen above the psychological level of 1734.521 and above the moving averages. At the same time, every week the price is more and more separated upward from these values. At the same time, the indicators also confirm the upward trend and build in the positive area. Thus, only bull trading options can be considered. If the market moves down, a downtrend is possible when the price falls below the trend line.


