Forex Weekly Forecast & FX Analysis June 07 - 11

EUR/USD
The past week led to a slight downward movement of the euro against the US dollar. This movement can be clearly seen both on the price chart and on indicators. If we consider graphical instruments, then the histogram is already at its minimum values in the negative area, the oscillator is testing the oversold area. If we look at the price chart, then the market has already dropped below the moving averages and was squeezed between two strong levels 1.2165 and 1.2083. In fact, as long as the price is within this range, you cannot trade, since this is market uncertainty. We are waiting for the range breakout and trade in the direction of the breakdown. An upward movement is most likely.

GBP/USD
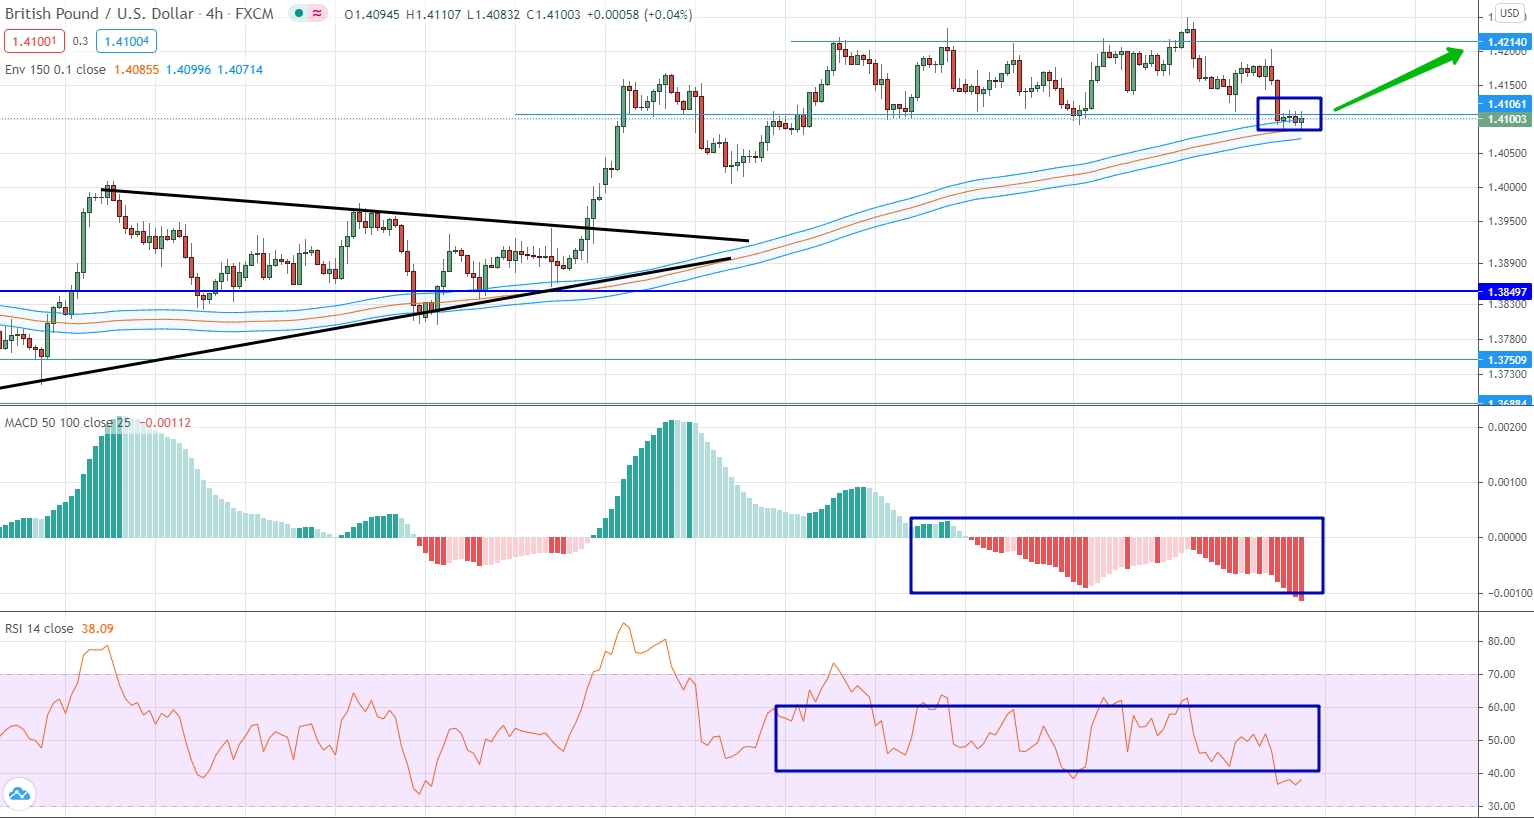
The British pound continues to trade within the 1.4214 and 1.4106 ranges against the US dollar. Typically, the indicators show contradictory information, since the histogram is clearly in the negative area, and the oscillator is built mostly neutral. The basic information for trading is provided by the price chart, where the market reached the level of the moving averages, which coincided with the lower border of the price channel, and then froze. Thus, it can be expected that this will be an excellent point for an upward movement.
USD/JPY
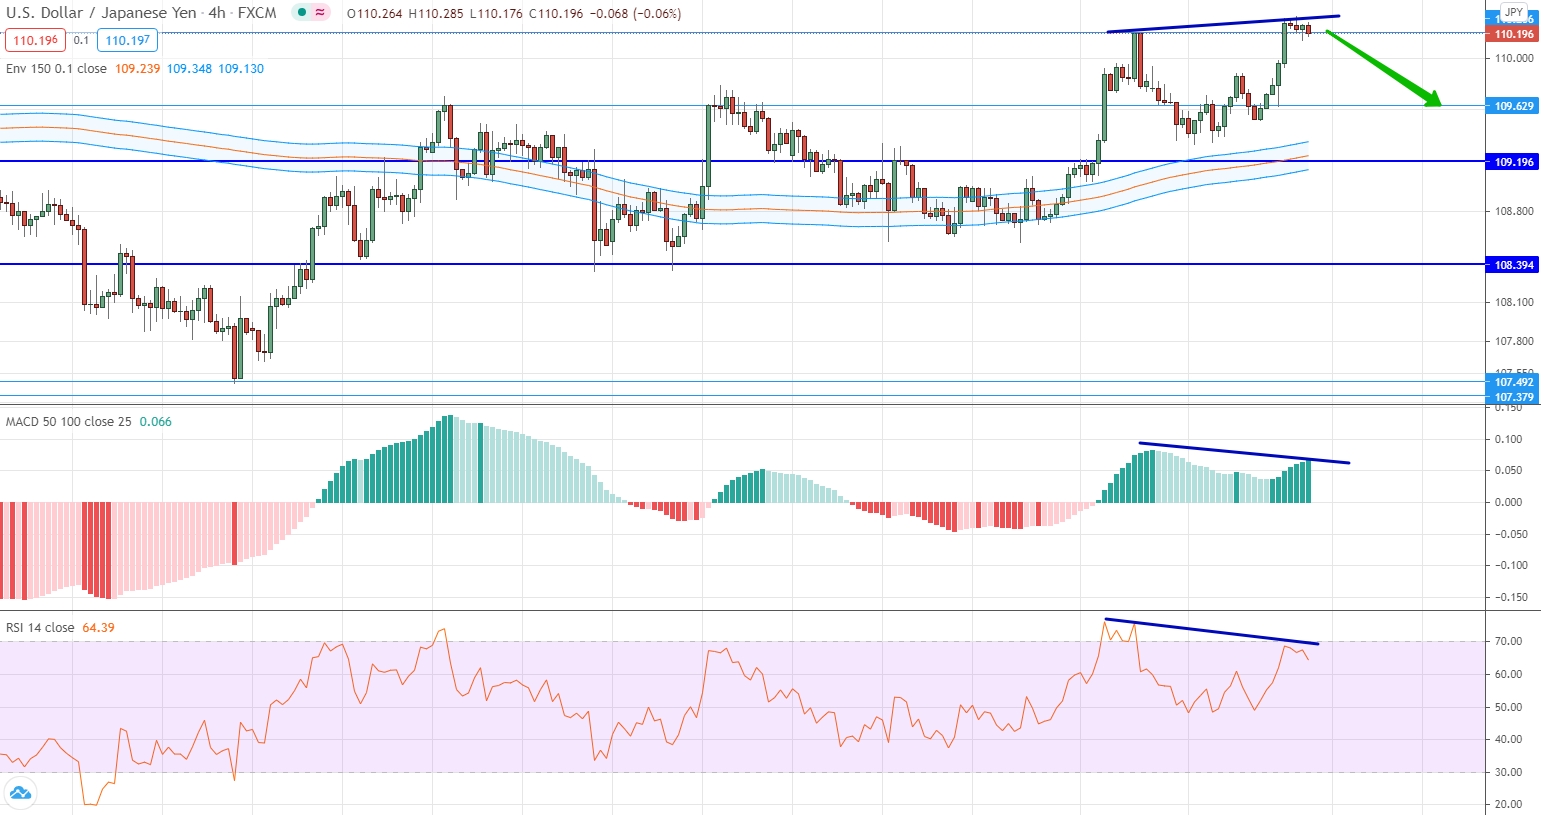
This currency pair is trying to form an uptrend and has twice tested the strong level of 110.150 within the last weeks. It is typical that the price is looking up, while the indicators are slightly looking in the opposite direction. Thus, we can talk about divergence, which means there is every reason to open a downward contract. The only thing to consider is the fact that trading is risky, since the divergence here is based on a thin one, since the discrepancies between the price and indicators are minimal.
AUD/USD
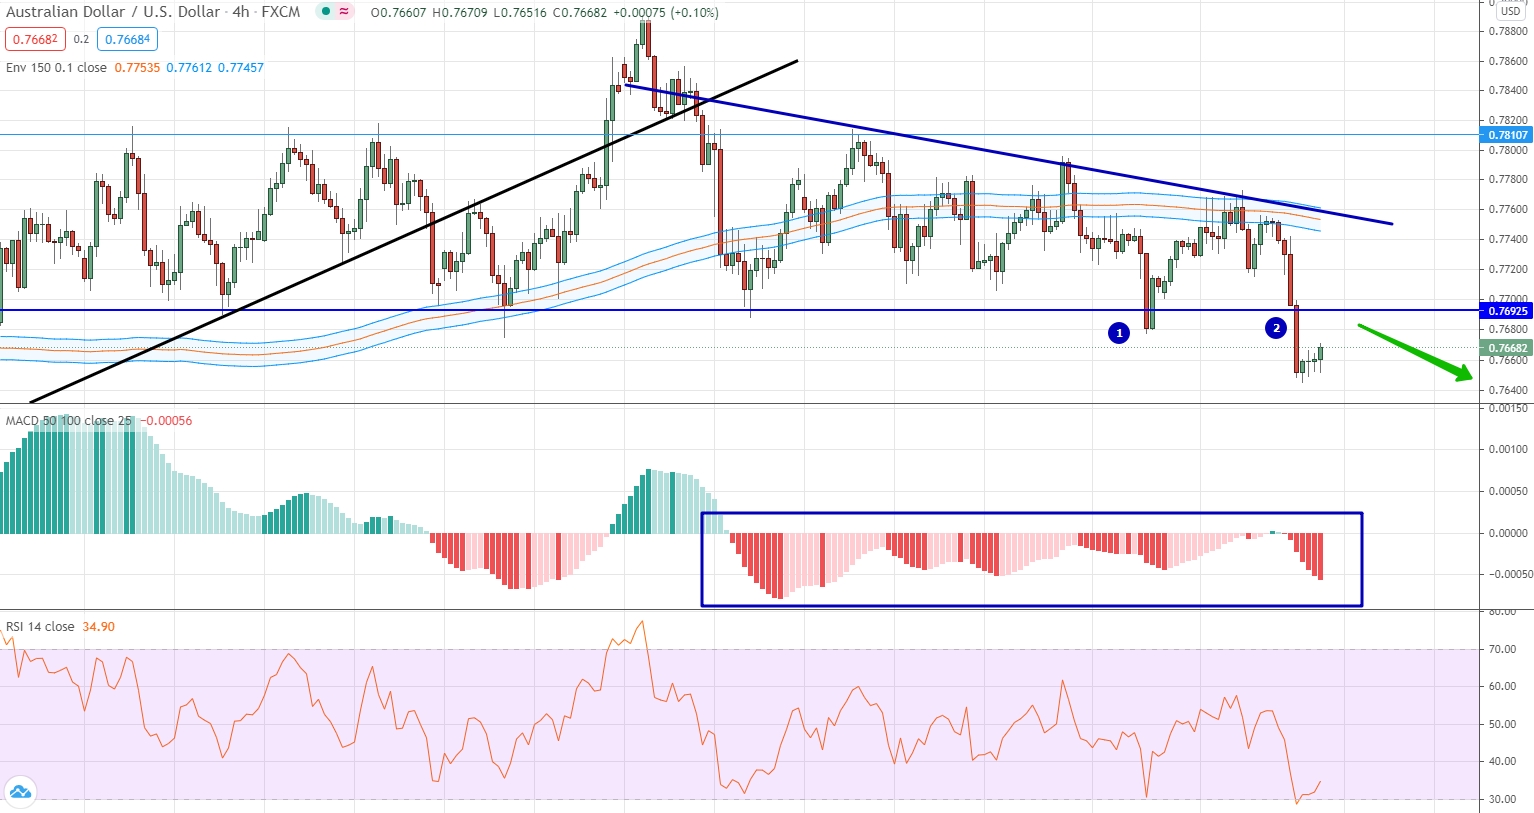
Globally, an upward trend continues to dominate for this currency pair, but locally, we see all the prerequisites for a downward movement and prerequisites for the formation of a new downward movement. First of all, we note the fact that the market itself has been looking down for the last month. Indicators are also mostly plotted in the negative area. A very important fact is that the moving averages have already changed their slope and are now looking down. An equally important factor is testing the 0.7692 level. Over the past 2 weeks, this level has been tested twice, and the second time the level was broken, and the price fixed below it. Thus, we can say that there is every reason for a bearish trade.
USD/CAD
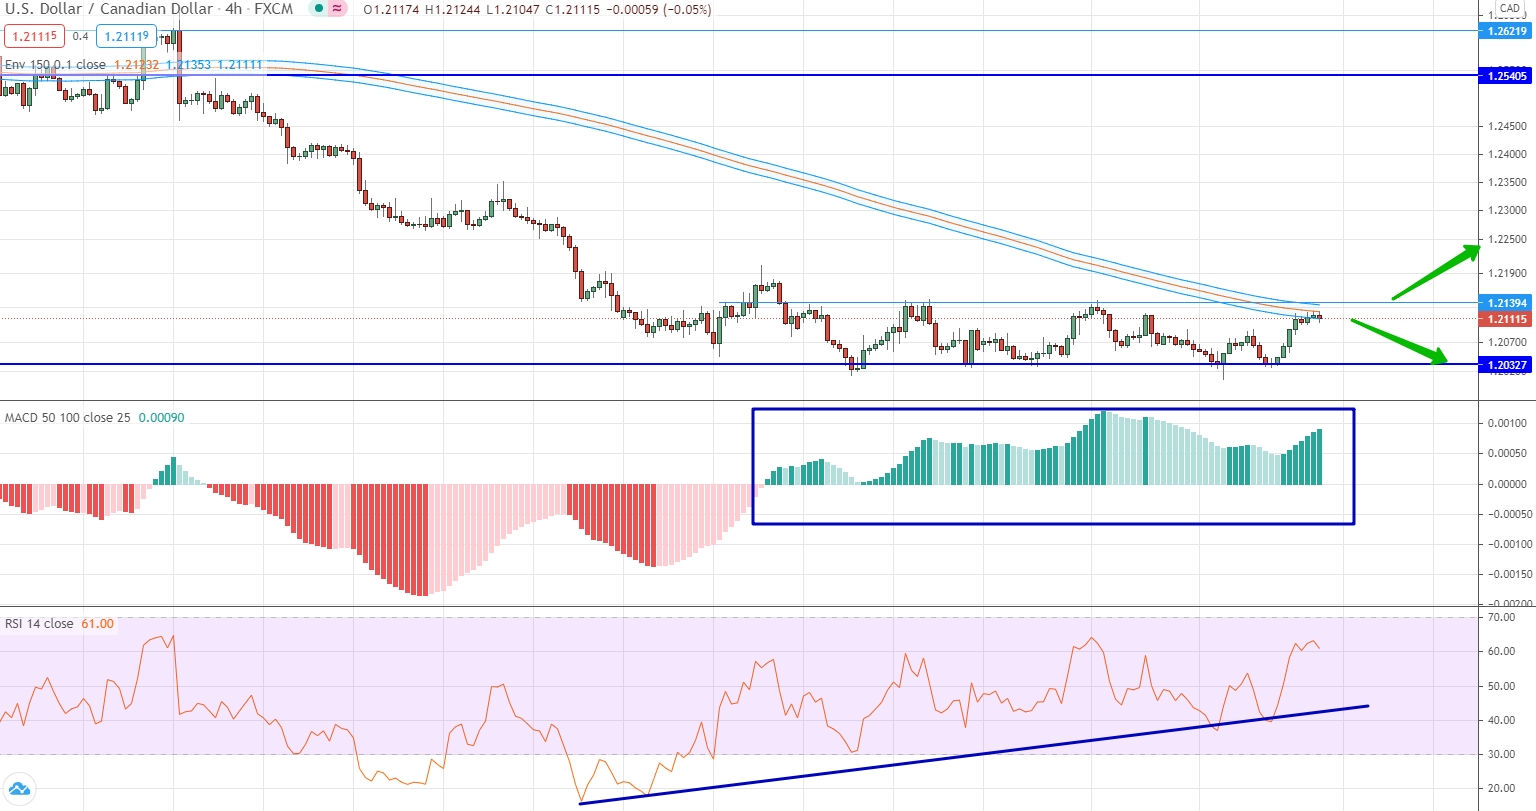
The US dollar against the Canadian dollar continues to recover after a fairly strong sell-off. In fact, we are now talking about a sideways range with borders at 1.2140 and 1.2032. For more than 3 weeks, the price has been developing within this range and practically does not go beyond its boundaries. The most important characteristic of the current market segment is that the indicators are looking up and are already building in a positive area, but a much more important fact is that the price reaches the level of moving averages. Thus, we can assume that since the moving averages now coincide with the upper border of the channel, the market has a reason for a downward movement. If the channel is broken upwards, then it will be possible to open an up contract.
USD/CHF
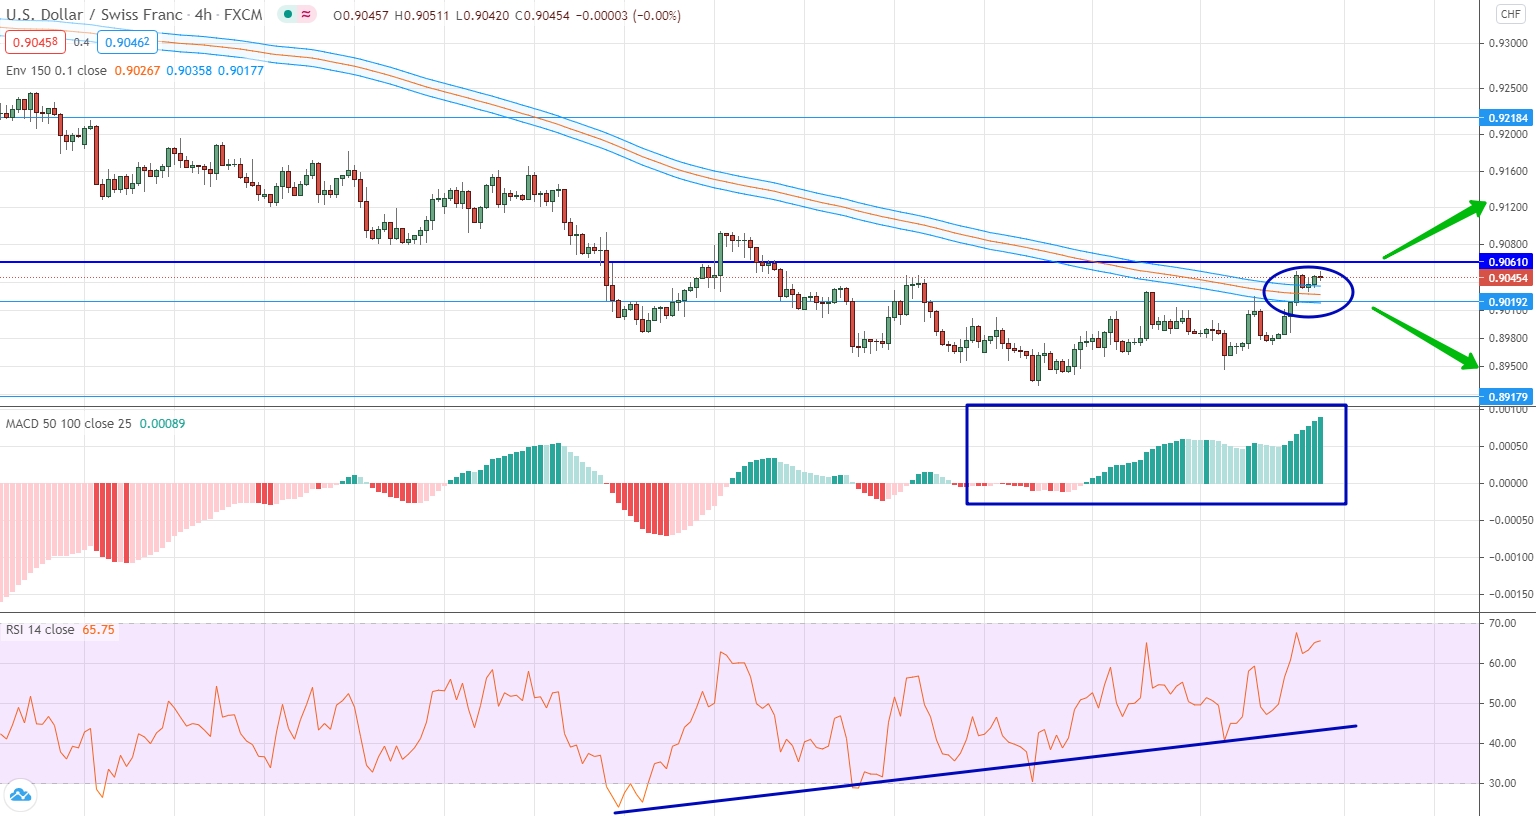
For this currency pair, an upward movement was observed last week, within which the price even slightly rose above the level of the moving averages. This applies to indicators, since they are generally built in a positive area, and update their local maximum value for more than a month. The current market situation is interesting in that there is a rather narrow price corridor, with the boundaries of 0.9061 and 0.9019. Since the corridor is quite narrow, you cannot trade within it. We are waiting in which direction the range will be broken and open a contract in the direction of the breakdown.
USD/RUB
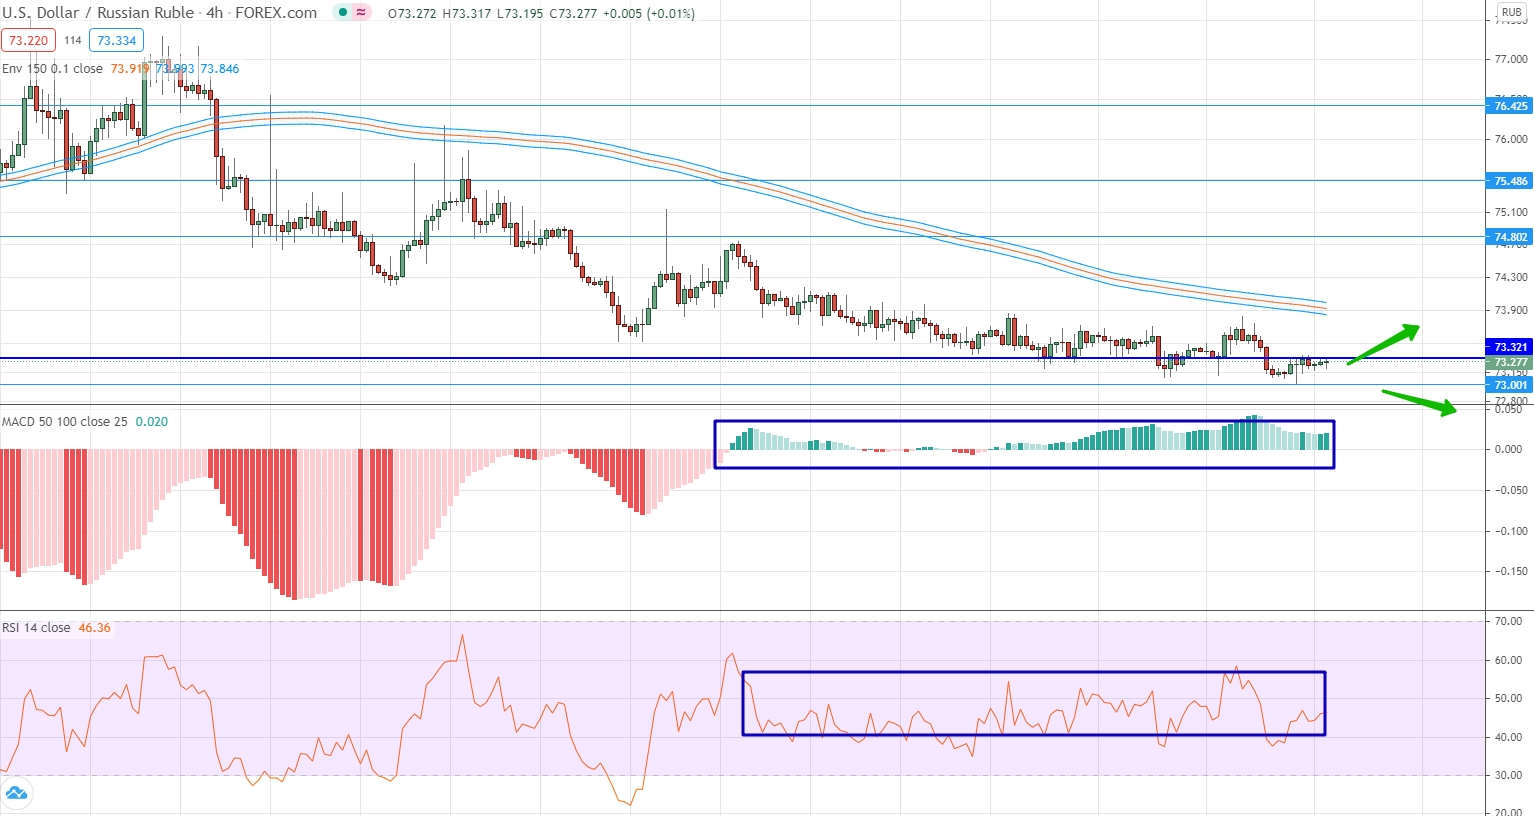
The US dollar continues to trade with elements of low volatility against the Russian ruble. The range of prices is really minimal and this is very clearly visible not only on the price chart, but also on the indicators. Almost all graphical instruments are built close to their neutral values and do not move far away from them. It is very important to note that within the last week the market was below the strong level of 73.32. Taking into account the fact that there was no strong movement, we can expect that this level will be broken upwards. As for the downward trade, to open such a contract, you need to wait until the market is below the 73.00 level.
Gold
The past week was ruled by a fairly strong downward movement of gold. In fact, what we talked about in the previous weekly review happened, when we stated the fact of the presence of divergence and touching the important level of 1909.434. Now we can talk about the opposite situation, when there is every reason to consider the possibility of trading up. First, the market is still dominated by an uptrend and has not lost its strength. Secondly, all indicators have already tested their local minimum values for more than a few months, and the oscillator, for the first time in a very long time, found itself in the oversold area. Thirdly, the price, having made a strong downward movement, slowed down in the area of the level of 1856.164, which simultaneously coincided with the levels of the moving averages. Thus, we have every reason to open an upward contract.


