Forex Weekly Forecast & FX Analysis March 08 - 12

EUR/CHF
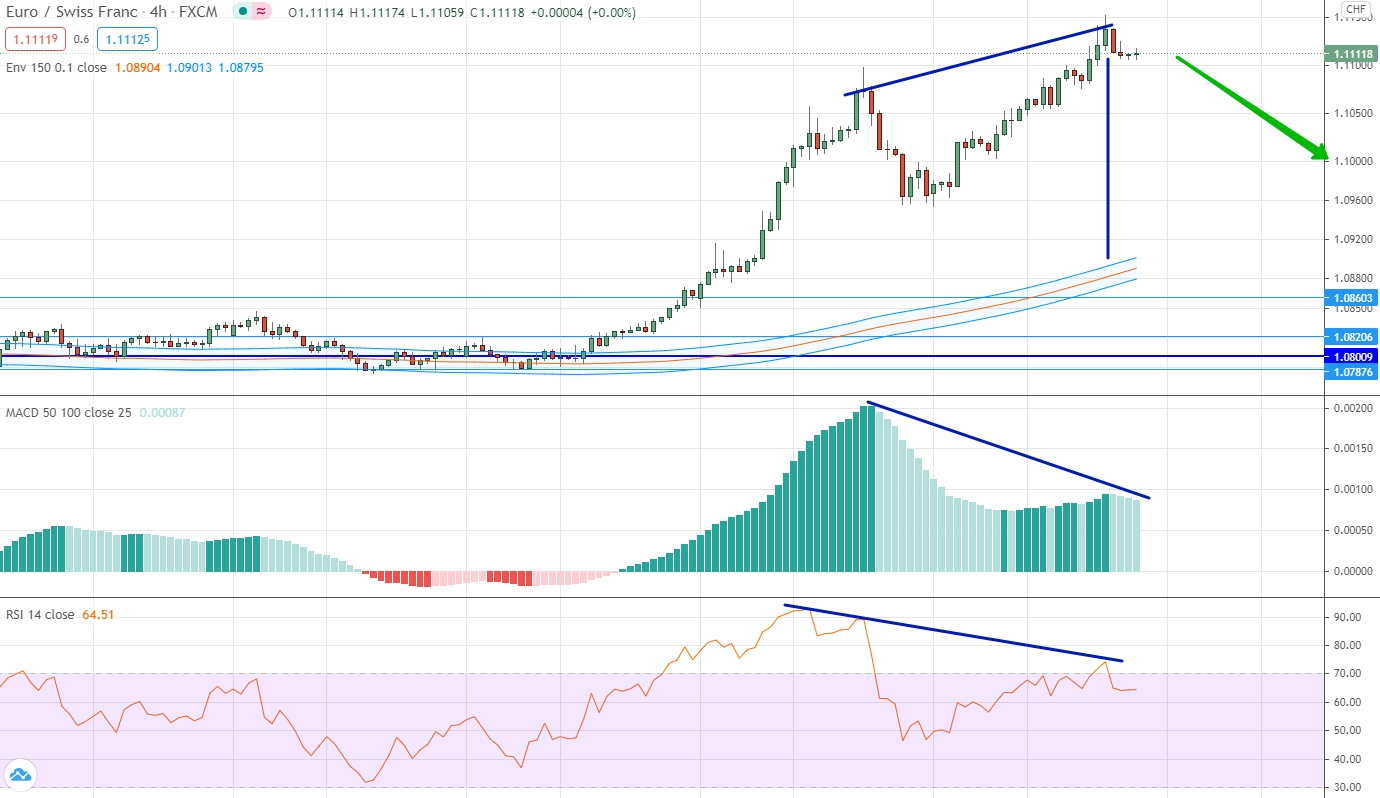
For the second week in a row, this currency pair has seen an upward volatility surge. It is now very important to note that this surge in volatility is controversial. At the very least, this is confirmed by the fact that two consecutive tops have formed on the price chart, but they are absolutely not confirmed by indicators. We also pay attention to the fact that the price has already significantly moved away from the level of the moving averages. In the aggregate, we can consider options for trading a fall, especially since the market usually likes to test important levels at which it has been for a long time.
NZD/USD
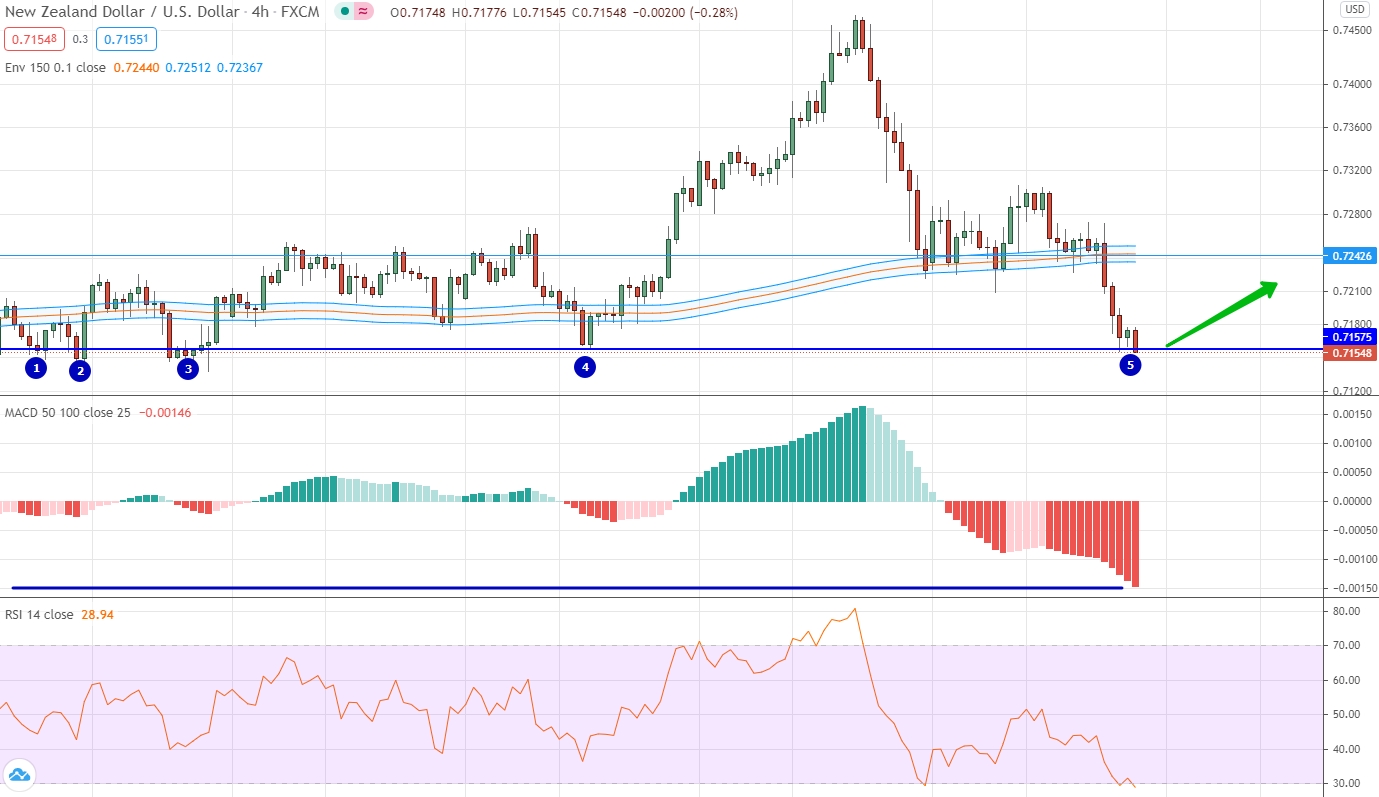
Trading in the New Zealand dollar against the US dollar in recent weeks has been characterized by elements of high volatility. The past week was marked by a downward movement, as a result of which the price was below the level of the moving averages and reached 0.7157. This level is psychologically very significant, because if we consider historical data, then even on the visible part of the chart, we mark at least five points where this level was tested and each time there was a rebound upward. Therefore, we expect that a similar scenario will repeat itself in this case.
EUR/RUB
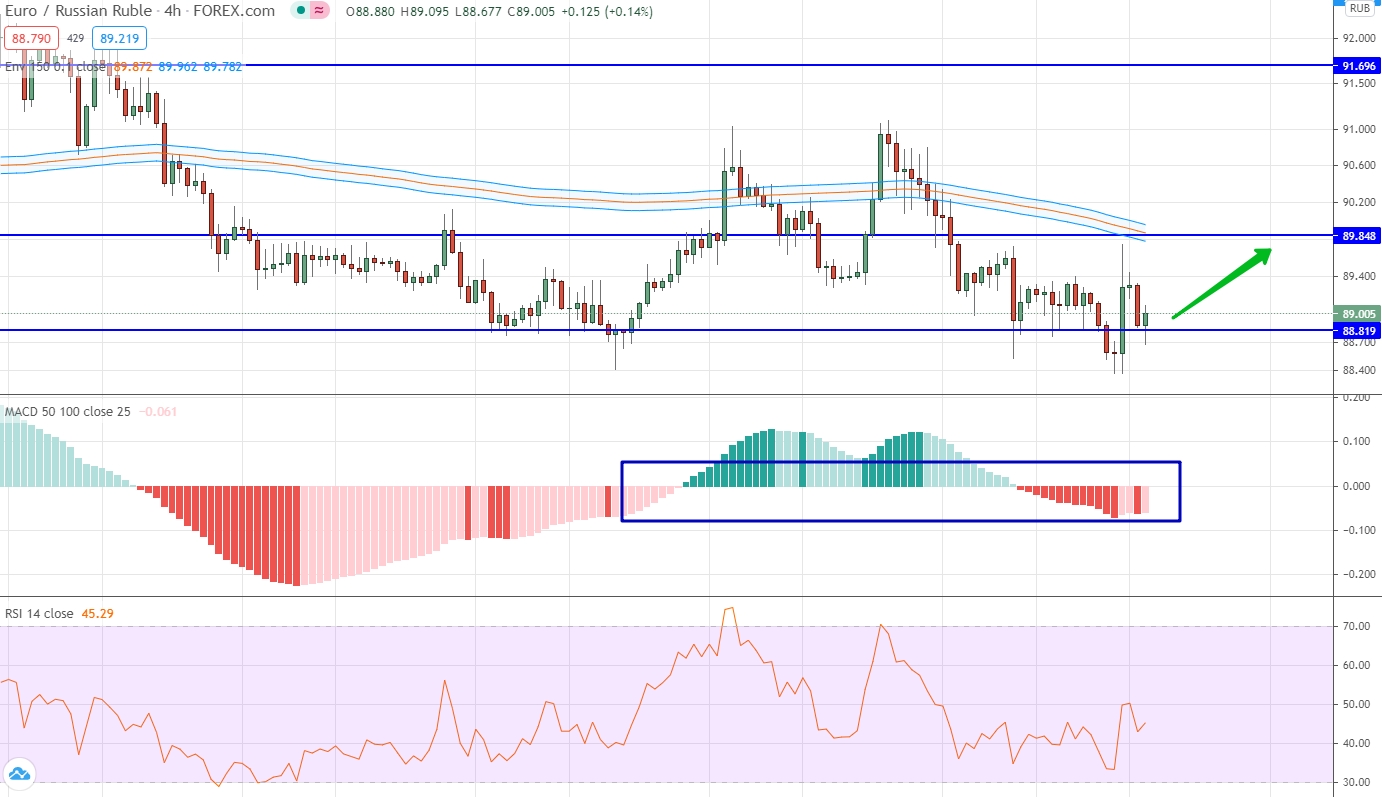
The price of the euro against the Russian ruble in the current market situation is squeezed within a sideways range with the borders of 88.8 and 89.85. There is no clear trend and basically the trades of the last few weeks are characterized by horizontal movement. This is confirmed not only by the price chart, but also by indicators that practically do not deviate from neutral values. Taking into account that the market is at the local minimum value and is now testing the lower line of the price channel, you can open an upward contract.
AUD/CHF
The Australian dollar continues to form an uptrend against the Swiss franc. Nevertheless, the high volatility of the previous trading weeks forces the market to take a pause, and this can be seen very well, first of all, in the histogram, which literally stuck to zero values. The price chart itself also shows some elements of a decline, but at the same time, the upward dynamics have not lost their significance. Therefore, you can only consider the options for trading up, but initially you need to wait for a downward correction in the area of the trend line.

GBP/CAD
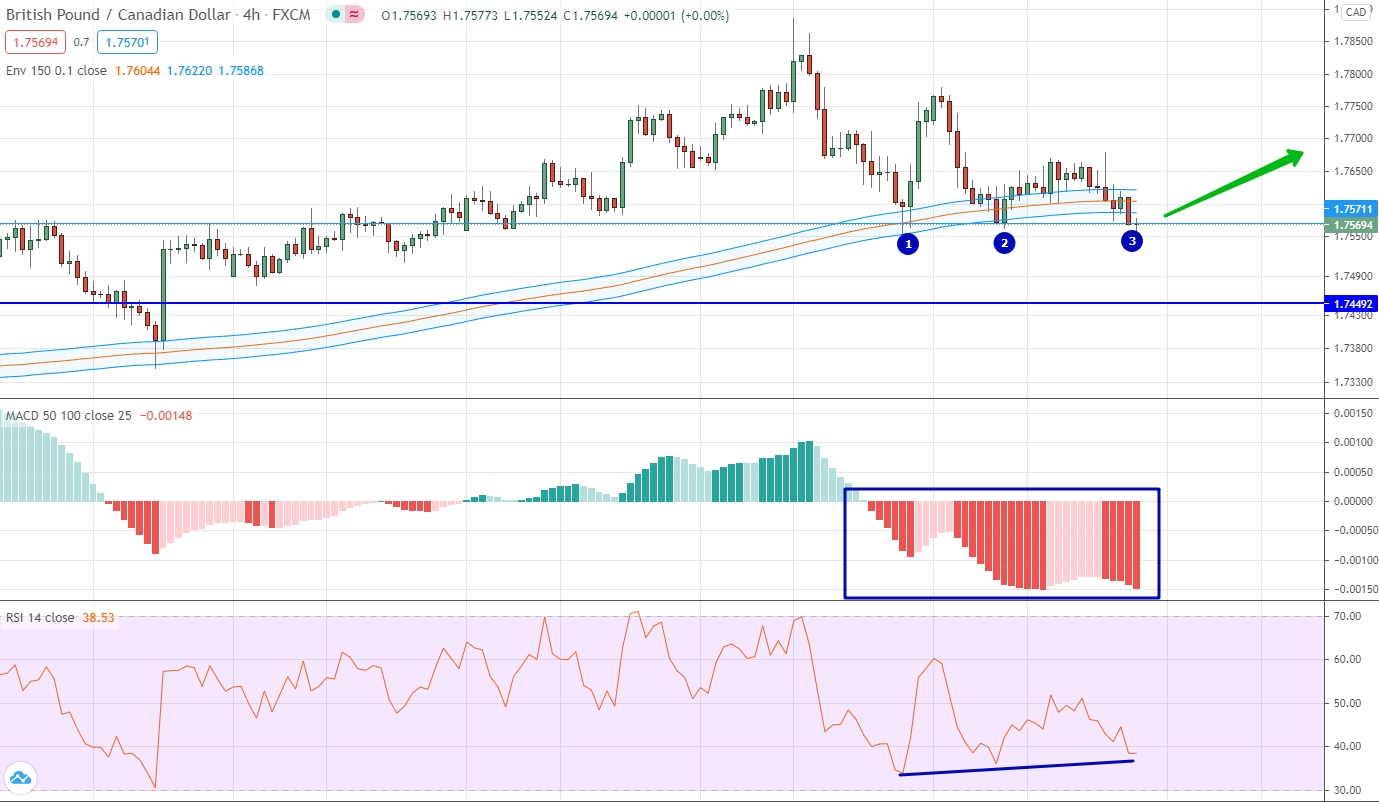
This currency pair during the last trading weeks has been characterized by a clear downward movement, which can be traced, among other things, by indicators, primarily by the histogram, which is already trading in a negative area and continues to fall. The most important characteristic of the price is that the downward movement has reached the level of the moving averages, which in this case coincides with the level of 1.7571. This level has been tested three times, and for the third time testing is taking place at the moment. If you look at the oscillator, then it already looks up slightly, so it makes it possible to think about the presence of divergence. Hence, an upward contract can be opened.
NZD/CHF
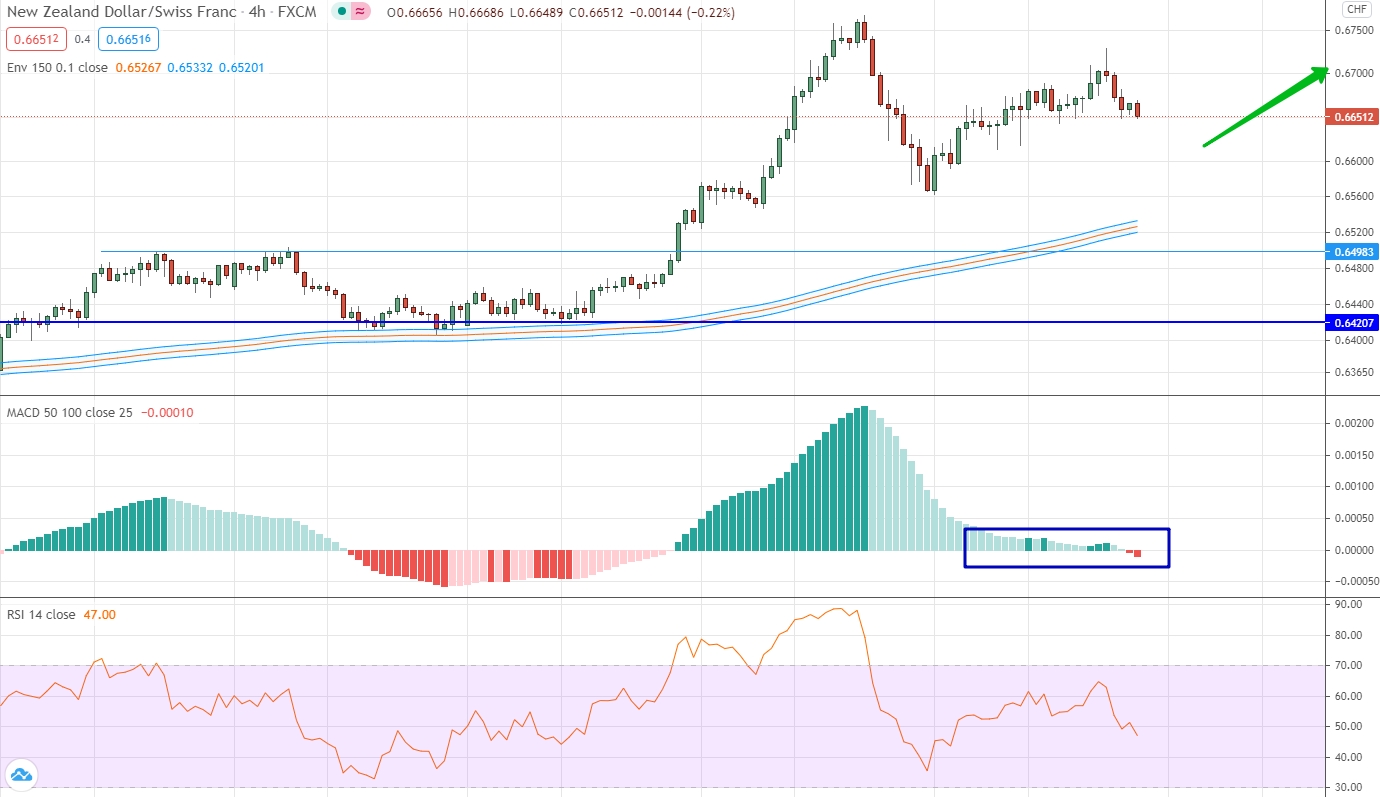
The New Zealand dollar against the Swiss franc is taking a break from the high volatility of the previous weeks. As a result, both the price and the main indicators do not show a strong movement, and basically last week they traded neutrally and with no obvious volatility. Nevertheless, we should note the fact that the upward dynamics dominate in the currency pair and it has not lost its strength. Therefore, the only possible option for trading is to open an upward trade, but such a trade will be acceptable only after a slight downward correction, when the price at least minimally approaches the moving average levels.
USD/CNH
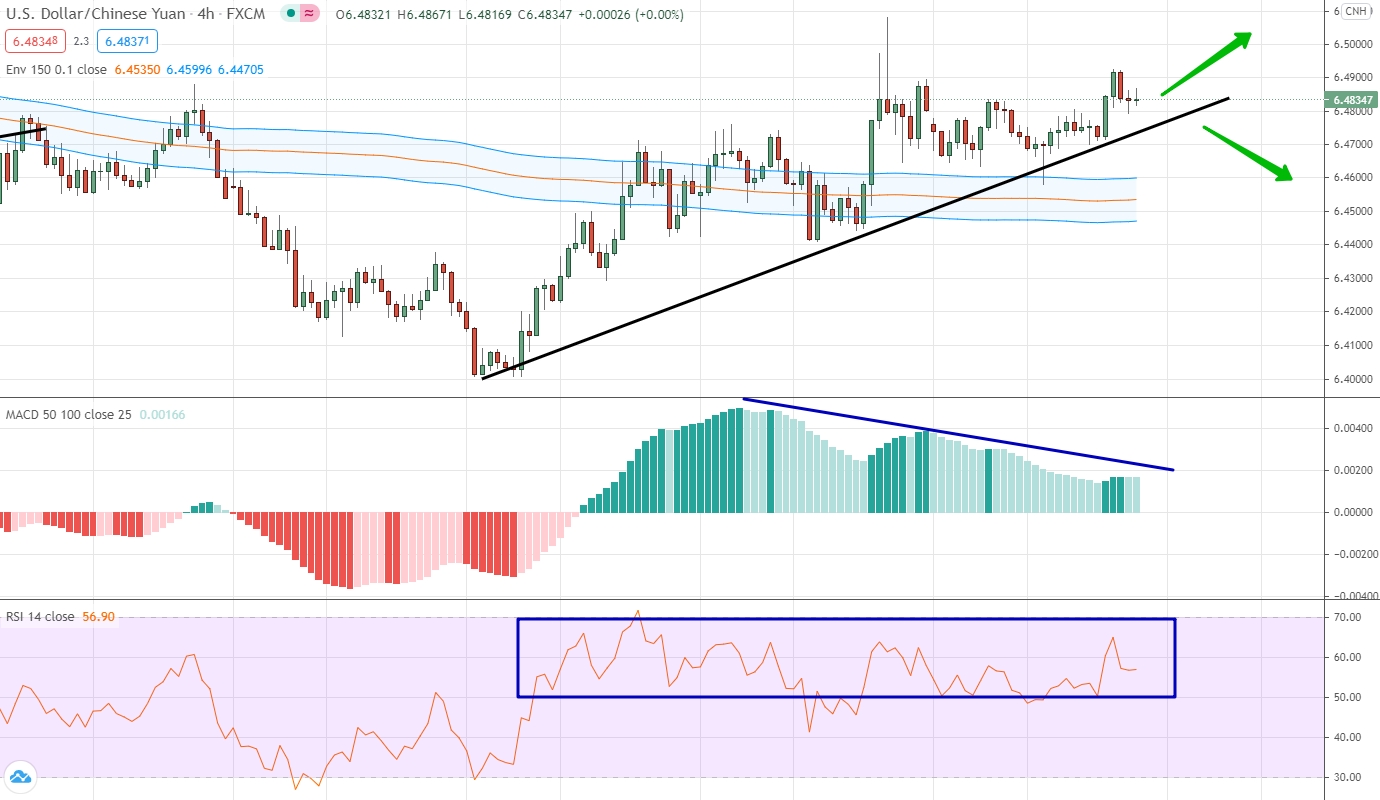
The price of the US dollar against the Chinese yuan is happening what we talked about in the previous weekly review: an attempt to form an uptrend. It is very important to pay attention to the fact that the price really continues to grow and continues to strengthen above the level of the moving averages, but if you look at the histogram, then it looks down and thus we are talking about the presence of divergence between the indicator and the price chart. Therefore, you can consider options for trading down, but a descending contract can be opened only if the price is below the trend line indicated on the chart, and such a deal can only be opened up to the level of moving averages. In general, the upward dynamics continues to remain relevant and trading for an increase within the current trend movement can also be considered while the price is above the trend line.
